Powerful Dashboards & Reports.
Visualise your entire network in under an hour with Statseeker out-of-the-box dashboards and reports.

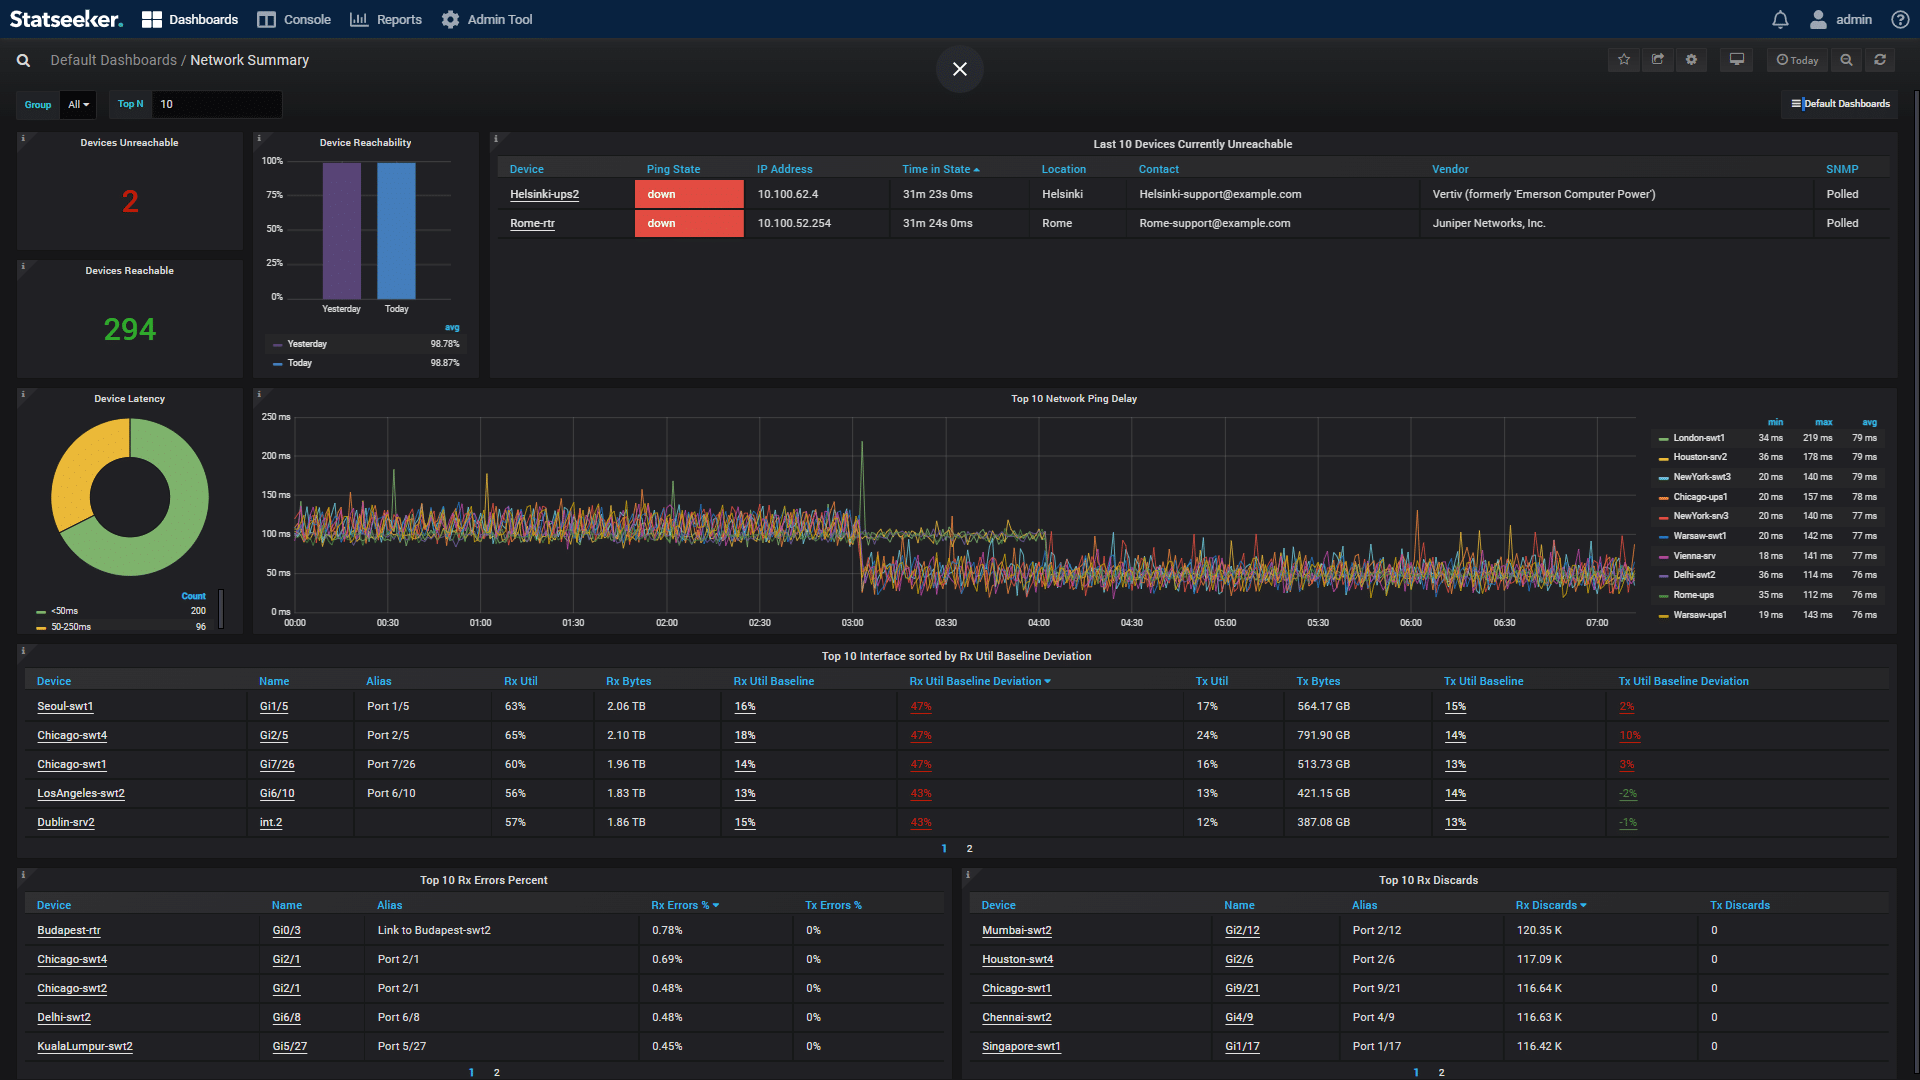
Network Summary Dashboard
A summary dashboard that loads instantly to help you spot issues across your network, such as a down device or a problem with latency.
Select any group or element on the dashboard to drill down to more detail, to identify the source of the issue in seconds.
All Statseeker dashboards allow network administrators to select any point in time to view the entire network status as it was then.


Device Overview Dashboard
A single page summary of your device statistics providing a instant view of a device’s performance.
Select any network device, for example, a firewall, router, or switch, for detailed information.
The dashboard displays memory utilization, CPU load data, device temperature, as well as traps and syslogs sent from the device.
Server Overview Dashboard
View any SNMP-enabled server on your network in seconds.
This dashboard helps network admins understand the stress a particular server is under. Determine the root cause of its under-performance, for example CPU utilization, insufficient memory, or low disk space.


Interface Overview Dashboard
This dashboard provides an overview of all interfaces on a device or in a user-defined group.
Select any interface in any group or on any device, for example filtering by WAN connections or assets at a particular site.
Drill down on any particular interface in your selected time frame, whether that be in the last 2 minutes or 2 years.
Asset Overview Dashboard
This dashboard provides a quick inventory of devices on your network, allowing you to drill down to device type issues, and discover the scale of effort required for a particular device type upgrade.
Quickly identify unused network assets and eliminate unnecessary CapEX investment by repurposing unused assets.


MAC/IP Switch Port Overview Dashboard
Use this dashboard to track the location and movement of specific assets over a selected period of time.
Network admins commonly use this dashboard to find specific pieces of equipment or identify rogue devices on the network.
Syslog Overview Dashboard
Instantly view details of events on the network, that may not be reported by the SNMP poller, meaning as network administrator you never miss an event.
Syslogs and traps in Statseeker can also be used to trigger alerts externally.
View the syslog message count for fast visibility of non-critical events.


Console
The console connects groups and individual devices to any report in Statseeker in seconds. The complete list of out-of-the-box reports available in Statseeker can be found here.
In addition, the console also includes fast access to selecting the Top N entries in a report, or a particular timeframe, allowing you to view as-polled data going back months or years.
Alert Configuration
Users can define and test their own alerting using simple forms. These forms also offer the flexibility to send emails, execute scripts, and communicate with third-party systems.
Alerts can be tailored to prevent alert flooding but still ensure network administrators are aware of problems as quickly as possible.
Statseeker alerts can also be based on forecast data. For example, 60 days before a firewall runs out of memory the responsible staff can be alerted that action is required.


Report Editor
Configure and schedule reports to suit your business requirements, quickly and easily. Reports such as weekly management reports or daily client SLA performance reports can be set up to be emailed automatically.
All aspects of network performance, including anomalies and capacity planning requirements, can be included and reported on.
In addition to the Statseeker out-of-the-box reporting and dashboards, network administrators are able to define and create their own dashboards and reports, or import them from the Statseeker dashboard library.
Statseeker support and professional services teams are also available to assist users.

