Fast and powerful network performance monitoring.
Statseeker, a Techniche product, is the world’s fastest network performance monitoring solution, trusted by private, Fortune 500 and S&P companies, and G20 governments around the world.
We don’t force you to compromise. Our solution delivers instant, granular-level visibility of your entire network and history, at a fraction of the cost of traditional monitoring tools.
Powerful network monitoring
Lower cost of ownership from day one.
Statseeker’s single server footprint, which polls and stores years of granular historical data for a network of up to 1 million interfaces, dramatically reduces your CAPEX expenses by identifying and redeploying under-utilized assets.
3x better visibility of critical issues.
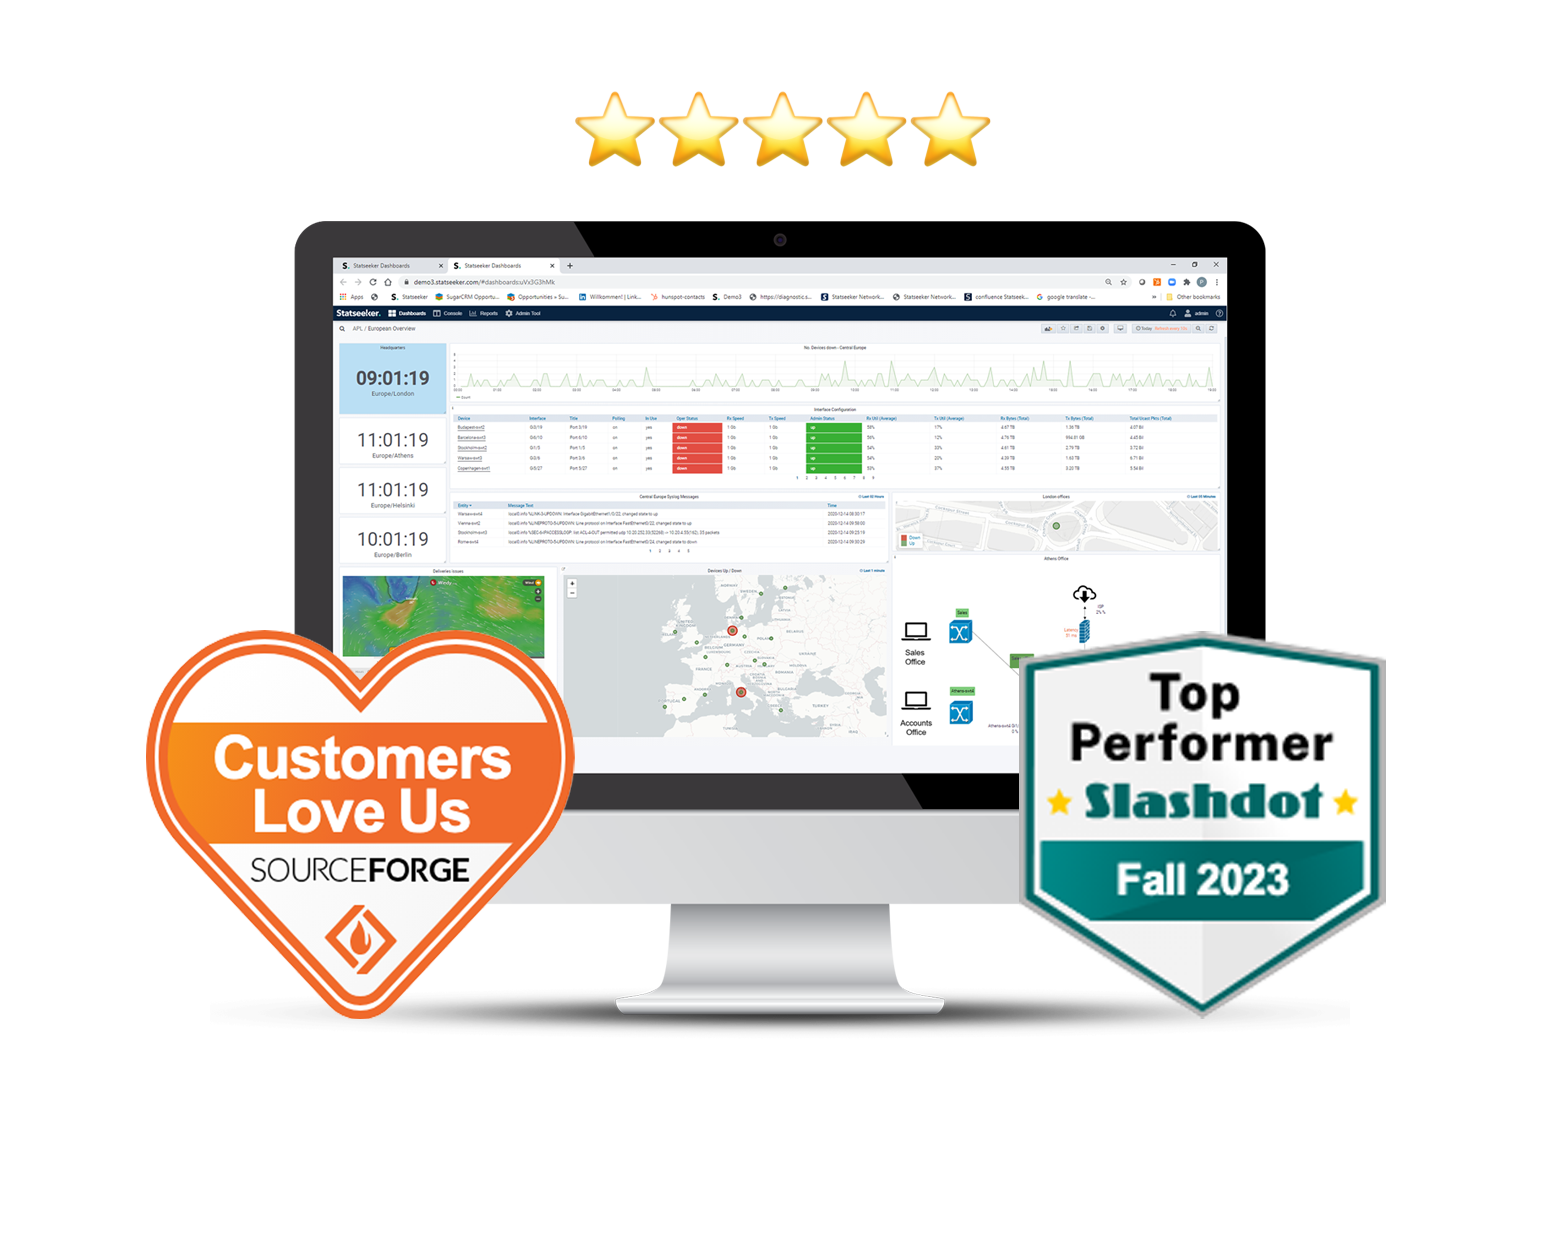
Start troubleshooting critical issues before users are even aware of them, with Statseeker’s 60-second polling and comprehensive selection of out-of-the-box dashboards and reports.
15x more powerful monitoring of service disruption and degradation.
Identify and remove costly blackspots across critical network links through enhanced thresholding and anomaly detection alerts.
1440x greater historical accuracy to support business decisions.
Remove all the guesswork in identifying over and underutilized infrastructure, conducting root cause analysis, or capacity planning, as Statseeker performance data is never averaged or rolled up.
Features
Simple Deployment On A Single Server
Install and deploy on a single physical server or VM in less than 30 minutes, and start detecting critical issues across your entire network within minutes.
Powerful Dashboards & Reports
Instantly access network metrics via a comprehensive selection of out-of-the-box dashboards and reports.
Scheduled and Rapid On-Demand Reporting
Keep abreast of key metrics through emailed reports; access any report, at any time, within seconds, not minutes.
Automated Discovery
Know what’s connected to your network at all times, with scheduled and on-demand automated discovery.
MAC IP Tracking & Reporting
Track devices and assets as they connect to, move from, or leave your network.
Hardware Inventory
Identify necessary updates, upgrades of critical assets, and locate under-utilized network infrastructure.
Hardware Health Monitoring
Identify stressed or failing hardware by tracking critical health metrics including temperature, CPU, memory load, humidity, and power supply.
High Availability
Minimize impact to your network monitoring architecture by adding redundancy, and removing points of failure.
SNMP Data Integrations
Access an extensive library of custom data type modules for additional monitoring and alerting; if you can’t find what you need, we’ll add new modules at no extra cost.
Real-Time Diagnostic Troubleshooting
Gain instant visibility of critical issues through live dashboards and rapid reporting, with the outcomes of your corrective actions visible via real-time dataflows.
Advanced Thresholding & Alerts
Configure thresholds and trigger alerts from raw and calculated values as well as the output of advanced analytics and data modelling.
Anomaly Detection
Real-time identification of unusual network behavior. Compare current behavior to data-backed, typical behavior, specific to your network.
Effortless Single-Pane-of-Glass Monitoring
Dashboards and reports, with option to embed 3rd party web content, for superior visibility across your network.
Custom Integrations
Easily integrate with 3rd party integrations and systems, including ITSM, SIEM, ChatOps, and alerts.
Custom Data Collection and Polling
Capitalize on the power of Statseeker to monitor non-SNMP data from other sources.
Intelligent Analytics & Forecasting
Support business strategies and transformation, with accurate projected data patterns of future network needs.
Geo-Location Mapping
Obtain a real-time, bird’s-eye view of issues specific to the geolocation of your network’s critical asset clusters.
SLA Reporting
Confirm that SLA targets are being met, and by what margin, using our pre-packaged and customized SLA reports. Investigate network performance with out-of-the-box Cisco IPSLA monitoring.
95th Percentile Interface Reporting
Understand your network’s typical behavior, by identifying and accounting for peak utilization.
Traffic Low Analysis (Netflow)
Monitor 100s of Netflow top talkers alongside NBAR (free of charge) for QoS implentation.
SDN Monitoring for CISCO ACI
Gain full visibility of live and historical data, as well as health metrics on all key ACI elements.