Scott Howard, Regional Sales Manager
I recently got a request from a customer to help them measure and report on network availability each month. My first question back to them was, what do you mean by ‘availability’? After some discussion, we narrowed it down to three areas:
- Device availability: the customer wants to be able to measure up-time of their critical devices
- Link availability: some devices are connected via redundant links, so even if one link in a pair were to fail the device at the other end would still be reachable. Because of this, they want to know the up time of each one of their critical links.
- Bandwidth availability: the customer needs to know the available bandwidth on their critical links. This customer is contractually obligated to ensure that their critical links do not exceed 70% utilization.
Device and interface groups
The first thing we needed to do was to specify the devices and interfaces for which availability is to be measured. This is done in Statseeker by creating logical groups.
In this example, we have two groups in play.
- “Routers” – a group of 50 routers that manage communication at each remote office
- “WAN Links” – a group of 51 MPLS links that connect remote locations to the data center
Groups in Statseeker can be created and managed manually. For further information, go to https://docs.statseeker.com/grouping-home/manual-grouping/
However, it’s much more efficient to use Statseeker’s auto grouping rules to manage your groups automatically. Auto grouping rules keep your groups up-to-date even as your network changes, since the rules are run at the completion of each network discovery and daily network re-walk. Further information can be found at https://docs.statseeker.com/grouping-home/automated-grouping/
Device availability
Statseeker allows you to define Service Level Agreements (SLAs) which specify an availability threshold and a time filter.
For more details: https://docs.statseeker.com/reporting/sla-reporting/
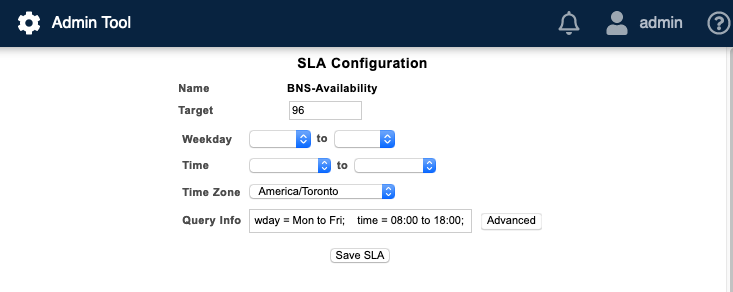
An example SLA “BNS-Availability” is shown in Figure 1. This SLA specifies a 96% up time over normal business hours (Monday through Friday, 8 AM to 6 PM).

Figure 1: Example SLA “BNS Availability”
Once the SLA is created, we need to group it with the devices that are to be measured against the SLA. This is done with the “entities to a group” command in Statseeker’s Admin Tool. More details can be found here: https://docs.statseeker.com/grouping-home/manual-grouping/#entityGroup
Reporting on device availability
To see performance against the SLA, run the “Device Group SLA Availability (13 months)” report from the Statseeker console.

Figure 2: Device Group SLA Availability report
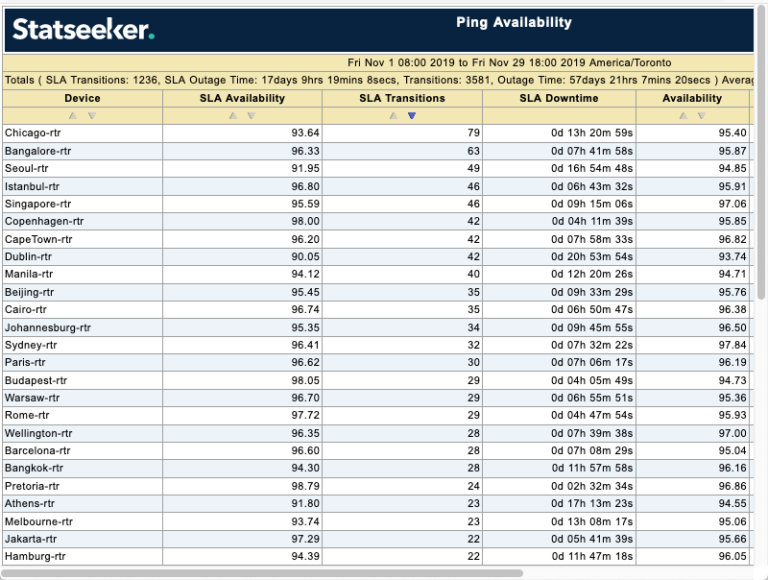
This report will highlight in red any months that didn’t meet the SLA threshold. These are hotlinks, so you can click on them and drill down to find out which devices are responsible for missing the SLA. For example, clicking on the red value for November 2019 brings up a Ping Availability report for the selected time frame and devices.

Figure 3: Ping Availability report for November 2019
The Ping Availability report also allows you to drill down to the specific ping-down events that affected the performance against the SLA, so you can get to the bottom of the issues that are affecting service delivery.
Interface availability
A device connected with redundant links would still be “up” even if one link in the redundant pair was down, so it makes sense to also monitor the availability of each critical link.
Measuring interface availability against an SLA is almost identical to device availability, so I won’t reproduce all the steps here. However, there is one important consideration for monitoring interface availability – it’s done by monitoring the OperStatus (link status) for each interface, which is computationally expensive and can generate huge volumes of event traffic if not carefully managed. For that reason, OperStatus polling is disabled by default on Statseeker. We recommend that you enable OperStatus polling only on the critical interfaces where it needs to be monitored, and leave it disabled on all other interfaces. This can be easily done in Statseeker using an auto grouping rule. More detail can be found at: https://docs.statseeker.com/reporting/sla-reporting/#enableIfOper
Once OperStatus polling is enabled, you can set up your SLAs, add them to your interface groups, and run Interface Group SLA reports similar to the use case for device SLAs.
Managing SLAs during maintenance periods
If you have planned downtime for system maintenance that overlaps an SLA, you may not want that downtime to count against your SLA performance. You can construct complex time filters in your SLAs to account for one-time or recurring maintenance periods. Your Statseeker team is available to help with the set up. Further detail can be found here: https://docs.statseeker.com/hdi/sla-timefilters/#singleMaint
Bandwidth Availability
Measuring available bandwidth is a whole different prospect than tracking a simple up / down status on a device or interface; it is very dependent on your specific needs. The customer I spoke with had a contractual requirement to maintain link utilization of less than 70%, so we decided to monitor this by setting a threshold on their critical links. A sample threshold is shown in Figure 4.

Figure 4: Threshold for WAN link utilization
Each time the threshold is crossed, a threshold event will be generated and stored in Statseeker. At the beginning of each month, a threshold event report can be run to see which links crossed the threshold, when it happened, and how long it stayed above the threshold. If needed, an alert could also be configured so that Statseeker sends an email whenever a threshold is crossed.
Further information on threshold configuration can be found here: https://docs.statseeker.com/alerts/threshold-configuration/

